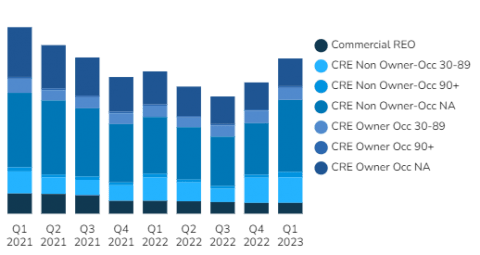
Distress in the commercial real estate loan sector continues to climb, topping out at $16.5B in Q1 2023. This is up from $13.8B in the previous quarter and $12B in Q3 2022.
Late-stage non-owner-occupied commercial mortgages are piling up, heavily contributing to the growing mountain of commercial debt.
Q1 data suggests trouble in CRE loan performance, and many other types of business debt. This comes as no surprise, as many former business and financial hubs are reportedly suffering an exodus, and layoffs grow.
Commercial REO figures haven’t budged from the previous quarter, though as late-stage non-performing loans stack up, this number is expected to increase over the next several months.
Let’s dive into the data…
Huge Spike in Non-Owner-Occupied CRE Loans
Moving into Q2 2023 non-performing loans held by banks included:
- $1.4B in 30-89 day late owner occupied loans
- $8.4B in nonaccrual stage non-owner occupied CRE loans (up nearly 30% from the previous quarter)
- $2.9B in 30-89 day late non-owner occupied loans
- $3.2B in nonaccrual stage owner occupied CRE loans
The largest pool of non-performing loans is in nonaccrual stage non-owner occupied loans.
Find out which banks have the most non-performing commercial loans inside BankProspector.
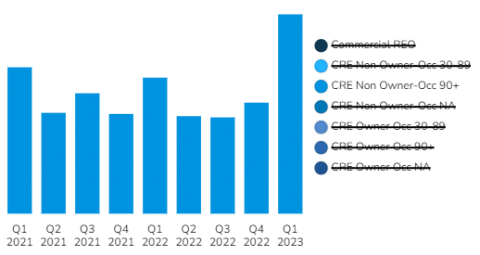
Construction Debt
Construction loan defaults are the second-highest they’ve been in the past 2 years.
The main change in the past quarter appears to be a 20% increase in newly distressed 1-4F construction loans, which seems to align with the rising interest rates and project cancellations in Q4 2022.
Banks are still sitting on just under half a billion dollars in construction REO, a small increase from the previous quarter.
Other Debt
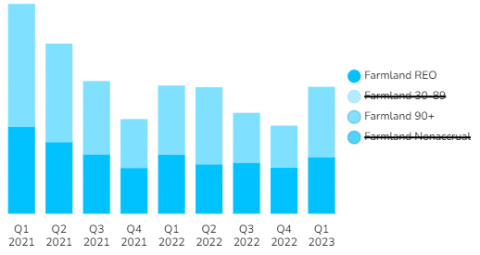
Agricultural
Farmland debt had a small uptick in distress last quarter, after 2 years of improvements.
The big increase in distress here appears to be led by a doubling of those falling into the 90 day plus late category and upticks in REO volume and newly 30-89 day late loans.
The largest part of this pool is around $651M in non-accrual debt followed by $395M in newly late loans, and $79M in REO.
Business Debt
Banks are reporting a slight improvement in business debt performance, with $22B in total non-performing debt, down from $23.7B in the previous quarter.
Just over $1B in non-performing C&I loans appear to have rolled over into the nonaccrual stage, with the overall distressed totals looking a lot like the first 2 quarters of 2022.
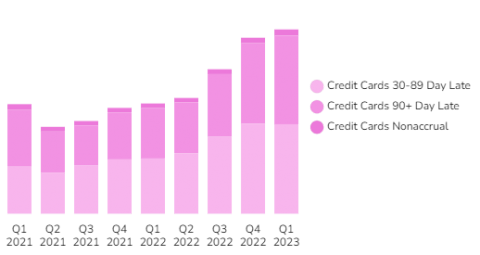
Consumer Debt: Auto Loans & Credit Cards
Non-performing auto loan debt saw some improvement from the previous quarter, though still totaled out at the second-highest level in 2 years.
Credit card debt distress keeps climbing each quarter, now nearly double what it was in Q1 2021. It appears that 30-89 day stage debt decreased slightly, while nonaccruals continue to mount.
It may be possible that tax refunds helped get some early-stage defaults back on track this quarter.
Looking Ahead
Commercial mortgage loan performance is expected to continue to go downhill. And with a rapidly declining demand for existing, aging CRE properties, banks may not have much hope in moving assets they acquire post-foreclosure.
Non-performing commercial note deals may be ripe for the picking in the coming months, as banks face lengthy, costly repossession processes to recoup on mounting nonaccrual stage debt.
Log in now to see which banks are holding the most distressed notes.