BankProspector Credit Union Data Updates: What’s New and What’s Changed
The National Credit Union Administration (NCUA) made some significant changes in 2022 to how credit unions complete the industry’s quarterly call report, and the BankProspector software team has released an update featuring the new reporting format. These categories and codes can help streamline data analysis and provide BankProspector users with additional lender insights.
Here’s a detailed breakdown of how these updates are now displayed, organized, and tracked in BankProspector:
Update Notes
â–º Data was previously reported as 3 sections, now split into 4 sections.
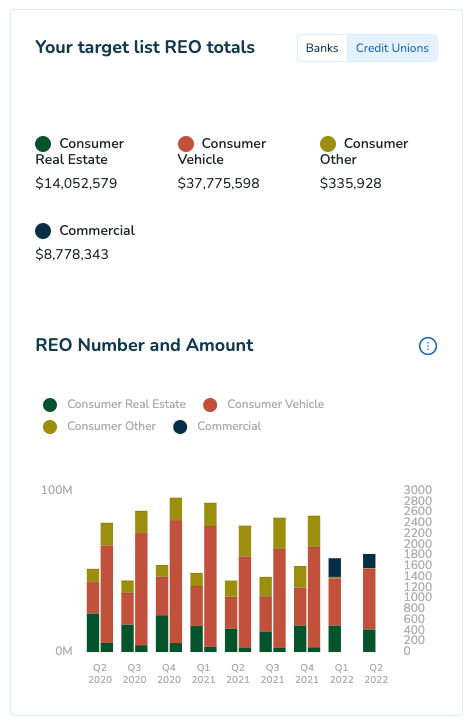
â–º The CU reports no longer share the Number of REO in each of these categories.
Your Targets’ Default History
Label Changes
Previously Reported Labels:
Now Reported as:
Junior RE
Junior Liens
1st Mortgage RE
1st Liens Real Estate
New Category
Multifamily (previously reported with Commercial)
Non-Reported
Loans Held for Sale
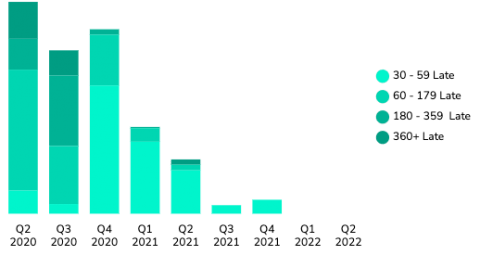
Current will show “No Data” pie chart
Historical will be included as long as last 8 quarters contain this data
Update Notes

â–º Historical charts will continue to group 60-179 days together for simplicity.
Credit Union Overview Updates
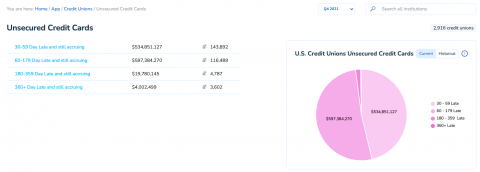
Unsecured Credit Cards
Current Delinquent Data Table
Previously Reported as:
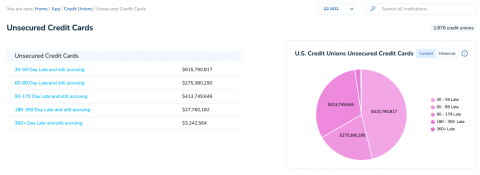
Now Reporting as:
30-59 Days
30-59 Days (no change)
60-179 days
60 – 89 Days (new)
—–
90 – 179 Days (new)
180 – 359 Days
180 – 359 Days (no change)
360+ Days
360+ Days (no change)
Previous View
Updated View
Update Notes

â–º No major reporting changes in this category.
Payday Alternative
Current Delinquent Data Table
Previously Reported as:
Now Reporting as:
30-59 Days
30-59 Days (no change)
60-179 days
60 – 89 Days (new)
—–
90 – 179 Days (new)
180 – 359 Days
180 – 359 Days (no change)
360+ Days
360+ Days (no change)
Update Notes

â–º No major reporting changes in this category.
Student Loans (Non-Guaranteed)
Current Delinquent Data Table
Previously Reported as:
Now Reporting as:
30-59 Days
30-59 Days (no change)
60-179 days
60 – 89 Days (new)
—–
90 – 179 Days (new)
180 – 359 Days
180 – 359 Days (no change)
360+ Days
360+ Days (no change)
Update Notes

â–º No major reporting changes in this category.
Vehicles
Current Delinquent Data Table
Previously Reported as:
Now Reporting as:
30-59 Days
30-59 Days (no change)
60-179 days
60 – 89 Days (new)
—–
90 – 179 Days (new)
180 – 359 Days
180 – 359 Days (no change)
360+ Days
360+ Days (no change)
Updated Charts
For Q1 2022 and future report data, current and historical charts are split to represent each subasset as well as delinquent table above to make data easier to view. Q4 2021 and all previous historical data will display in pre-Q1 2022 formats.
Vehicle Subassets
New Vehicles
Old Vehicles
Update Notes

â–º No major reporting changes in this category.
1st Liens Real Estate (Previously 1st Mortgage RE)
Current Delinquent Data Table
Previously Reported as:
Now Reporting as:
30-59 Days
30-59 Days (no change)
60-179 days
60 – 89 Days (new)
—–
90 – 179 Days (new)
180 – 359 Days
180 – 359 Days (no change)
360+ Days
360+ Days (no change)
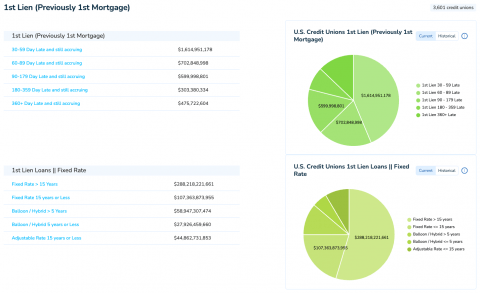
1st Lien (Previously 1st Mortgage) Subassets
Updated Charts
For Q1 2022 and future report data, current and historical charts are split to represent each subasset as well as delinquent table above to make data easier to view. Q4 2021 and all previous historical data will display in pre-Q1 2022 formats.
1st Liens Real Estate Subassets
1st Lien Loans
1st Lien Loans || Rate Types and Terms
Broken down by rate type and loan term
Fixed Rate
> 15 years
15 years or less
Balloon / Hybrid
> 5 years
5 years or less
Adjustable Rate
15 years or less
Update Notes

â–º No major reporting changes in this category.
Junior Lien Loans (Previously Junior RE)
Current Delinquent Data Table
Previously Reported as:
Now Reporting as:
30-59 Days
30-59 Days (no change)
60-179 days
60 – 89 Days (new)
—–
90 – 179 Days (new)
180 – 359 Days
180 – 359 Days (no change)
360+ Days
360+ Days (no change)
Update Notes

â–º No major reporting changes in this category.
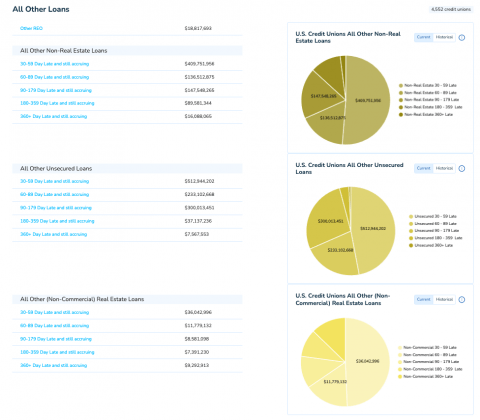
All Other Loans
Label Changes
Previously Reported Label:
Now Reported as:
REO – Other
REO – Consumer Other
section Changes
Previously Reported as 1 Section:
Now Reported as 3 Sections:
All Other Loans
All Other Non-Real Estate Loans / LOC
All Other Unsecured Loans / LOC
All Other (Non-Commercial) Real Estate Loans / LOC
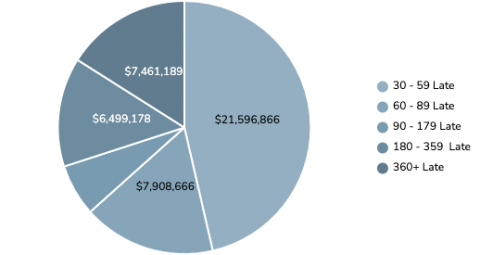
Current Delinquent Data Table
Previously Reported as:
Now Reporting as:
30-59 Days
30-59 Days (no change)
60-179 days
60 – 89 Days (new)
—–
90 – 179 Days (new)
180 – 359 Days
180 – 359 Days (no change)
360+ Days
360+ Days (no change)
Updated Charts
For Q1 2022 and future report data, current and historical charts are split to represent each subasset as well as delinquent table above to make data easier to view. Q4 2021 and all previous historical data will display in pre-Q1 2022 formats.
Update Notes

â–º Label change: "REO - Other" is now "REO - Consumer Other"

â–º Section breakdown: "All Other Loans" is now 3 sections
Commercial RE
Label Changes
Previously Reported as:
Now Reported as:
Member Commercial RE
Secured by Owner Occupied Property Loans
Nonmember Commercial RE
Secured by Non-Owner Occupied Property Loans
Current Delinquent Data Table
Previously Reported as:
Now Reporting as:
30-59 Days
30-59 Days (no change)
60-179 days
60 – 89 Days (new)
—–
90 – 179 Days (new)
180 – 359 Days
180 – 359 Days (no change)
360+ Days
360+ Days (no change)
Updated Charts
For Q1 2022 and future report data, current and historical charts are split to represent each subasset as well as delinquent table above to make data easier to view. Q4 2021 and all previous historical data will display in pre-Q1 2022 formats.
Commercial RE Subassets
Commercial and Industrial
Unsecured Commercial Loans
Unsecured Revolving LOC Loans
Update Notes

â–º Multifamily is now a separate category, no longer grouped with Commercial
Multifamily (New Category)
Current Delinquent Data Table
Previously Reported as:
Now Reporting as:
30-59 Days
30-59 Days (no change)
60-179 days
60 – 89 Days (new)
—–
90 – 179 Days (new)
180 – 359 Days
180 – 359 Days (no change)
360+ Days
360+ Days (no change)
Update Notes

â–º Multifamily is now a separate category, no longer grouped with Commercial
Business Loans
Section Changes
Previously Reported as 2 Sections:
Now Reported as 3 Sections:
Member Commercial Loans Not Secured
Commercial and Industrial Loans
Nonmember Commercial Loans Not Secured
Unsecured Commercial Loans
Unsecured Revolving LOC Loans
Current Delinquent Data Table
Previously Reported as:
Now Reporting as:
30-59 Days
30-59 Days (no change)
60-179 days
60 – 89 Days (new)
—–
90 – 179 Days (new)
180 – 359 Days
180 – 359 Days (no change)
360+ Days
360+ Days (no change)
Updated Charts
For Q1 2022 and future report data, current and historical charts are split to represent each subasset as well as delinquent table above to make data easier to view. Q4 2021 and all previous historical data will display in pre-Q1 2022 formats.
Business Loan Subassets
Commercial and Industrial Loans
Unsecured Commercial Loans
Unsecured Revolving LOC Loans
Update Notes

â–º Expanded subasset categories
Farm & Agricultural
Section Changes
Previously Reported as 1 Section:
Now Reported as 2 Sections:
Farm & Agricultural
Agricultural Loans
Farmland Loans
Current Delinquent Data Table
Previously Reported as:
Now Reporting as:
30-59 Days
30-59 Days (no change)
60-179 days
60 – 89 Days (new)
—–
90 – 179 Days (new)
180 – 359 Days
180 – 359 Days (no change)
360+ Days
360+ Days (no change)
Updated Charts
For Q1 2022 and future report data, current and historical charts are split to represent each subasset as well as delinquent table above to make data easier to view. Q4 2021 and all previous historical data will display in pre-Q1 2022 formats.
Farm & Agricultural Subassets
Agricultural Loans
Farmland Loans
Update Notes

â–º Expanded subasset categories
Construction
Section Changes
Previously Reported as 2 Sections:
Now Reported as 1 Section:
Commercial Construction & Development
Commercial Construction & Development
Residential Construction
None – no longer reporting Residential Construction category
Current Delinquent Data Table
Previously Reported as:
Now Reporting as:
30-59 Days
30-59 Days (no change)
60-179 days
60 – 89 Days (new)
—–
90 – 179 Days (new)
180 – 359 Days
180 – 359 Days (no change)
360+ Days
360+ Days (no change)
Update Notes

â–º No longer reporting Residential Construction
Loans Held for Sale
*No longer reported*
Charts – Historical
We’ll still show historical data for this asset type:
Shown in Historical Charts
Quarter Drop Downs Prior to Q1 2022 will be populated