


Banc of California
Locations
Banc of California REO
Banc of California's REO and Non-Performing Loan Report
Banc of California's REO Report
Banc of California's bank owned homes total $7.39 M 0% from the previous quarter. Banc of California foreclosures include $0 commercial REO, $0 multifamily REO, $0 farmland and agricultrual REO, and $0 in construction loan REOs. To get a Banc of California foreclosures list you must contact an REO asset manager at the REO department. Use the button on the right to find workout officers, asset managers, and other contacts at Banc of California BankProspector helps you easily find the special assets and REO department contacts or any other Banc of California decision maker.
Banc of California Portfolio Info
Subscribers have access to the portfolio info for Banc of California and any other Banks in California.
Our members use BankProspector to find and qualify banks and bank contacts with distressed assets. BankProspector is the fastest easiest way to source your own bank direct deals. Find the Asset Managers at Banc of California as Well as Other Bank Contacts Subscribers use BankProspector to find contacts including executives and officers in departments like special assets or workout departments.
Banc of California FDIC Call Report
All of the portfolio and financial information in our reports is pulled directly from FDIC. We take updates from the federal reporting database for all US banks.
Banc of California's Late and Non-Performing Loan Portfolios
Residential 1st Position Loans
Residential Junior Position Loans
HELOCs
Commercial Real Estate Loans
(Non Owner-Occupied)
Commercial Real Estate Loans (Owner-Occupied)
Multifamily and Apartment Loans
Residential Construction Loans
Commercial and Development Construction Loans
Farmland Loans
Business Loans (C&I)
Non Performing Auto Loans
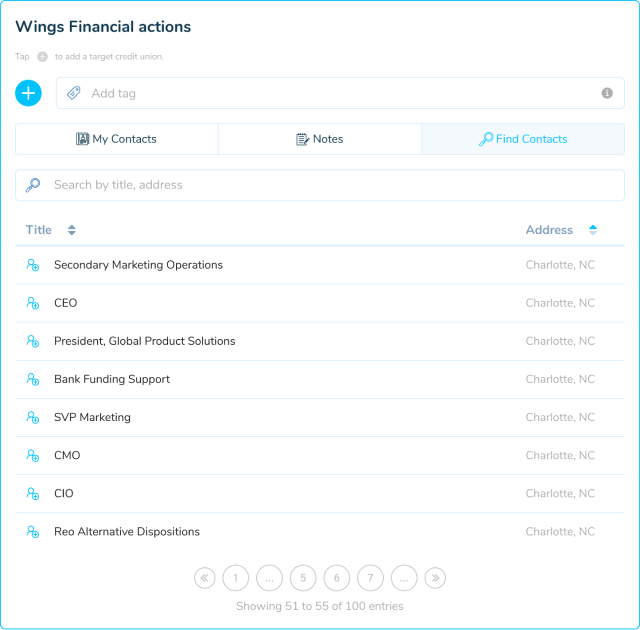
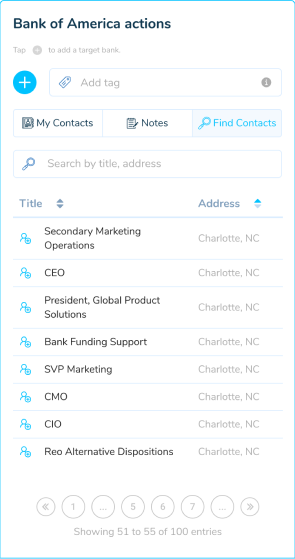
Banks actions

There are no contacts for this bank yet.
But you can request the contact.
Enter ONE title. Multiple titles will be deleted and requests ignored.
Enter a title: REO manager, special assets, workout, secondary marketing, credit officer, etc. You have 0 of 10 open contacts requests. You have used 0 of your total 0 contacts this period.
Didn't find the contact you are interested in? Request a contact Enter ONE title. Multiple titles will be deleted and requests ignored.
Enter a title: REO manager, special assets, workout, secondary marketing, credit officer, etc. You have 0 of 10 open contacts requests. You have used 0 of your total 0 contacts this period.
Title |
Address |
|---|---|
|
|
Charlotte, NC |
|
|
Charlotte, NC |
|
|
Charlotte, NC |
|
|
Charlotte, NC |
|
|
Charlotte, NC |
|
|
Charlotte, NC |
|
|
Charlotte, NC |
|
|
Charlotte, NC |
Secondary Marketing Operations added to My Contacts
You have exceeded your contact limit.
Upgrade for MoreFarmland tag was removed.
UndoThis title was already requested.
Banc of California Foreclosures and Non-Performing Loans
What can we help you find?
Here’s an example of our data
We track and report all the foreclosure, REO (bank owned property) non-performing note, and decision maker information for every bank and credit union in the United States and U.S. Territories.
Since 2009 we've been tracking REO, non-performing loans, and contact information for every other bank and credit union in the US. Join our free private list and we'll show you how you can start doing more bank direct deals.